Taking notes in class helps you remember (and grasp) what you learn. Weak, disorganised, and confused class notes are useless. Not only should you take notes, but you should also summarise the essential points. Let’s examine the most popular note-taking methods.
1) METHOD SUMMARY
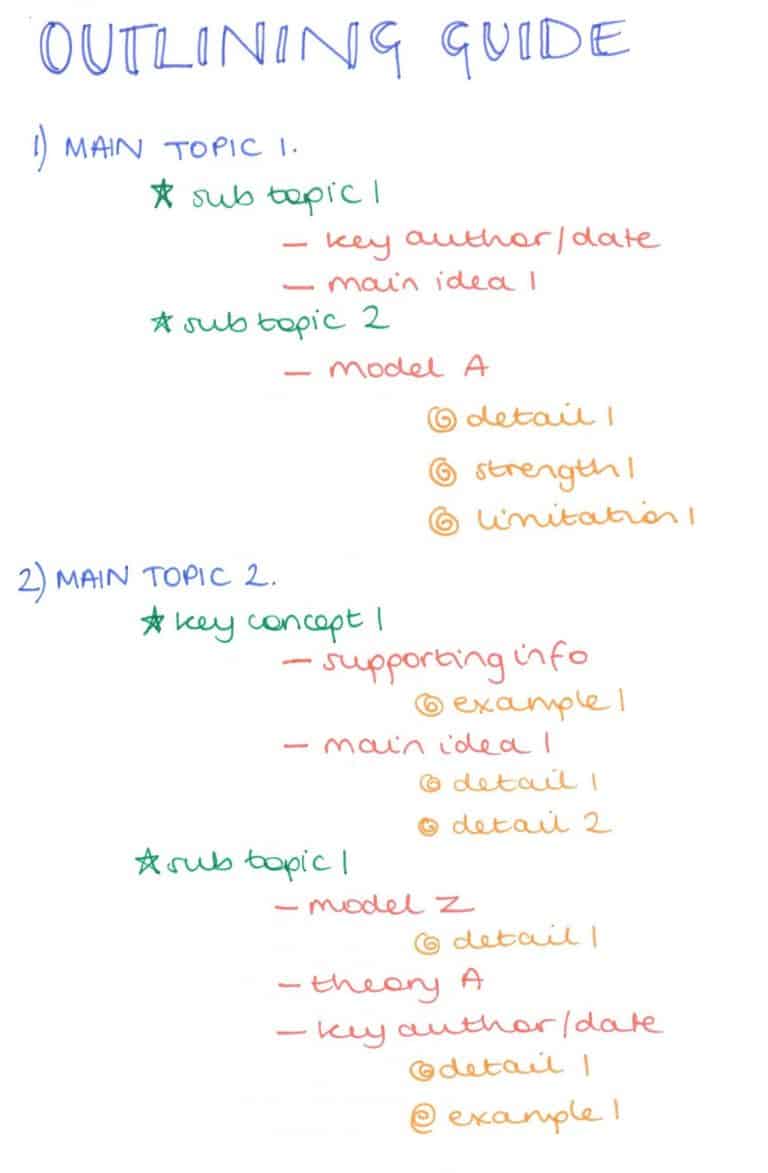
The Outline technique is one of the most fundamental note-taking strategies. For each subject and subtopic, you simply highlight them using bullet points. Use indents to add related subtopics beneath the major topics on your page. This is one of my favourite strategies for presentations or seminars.

2) CORNELL
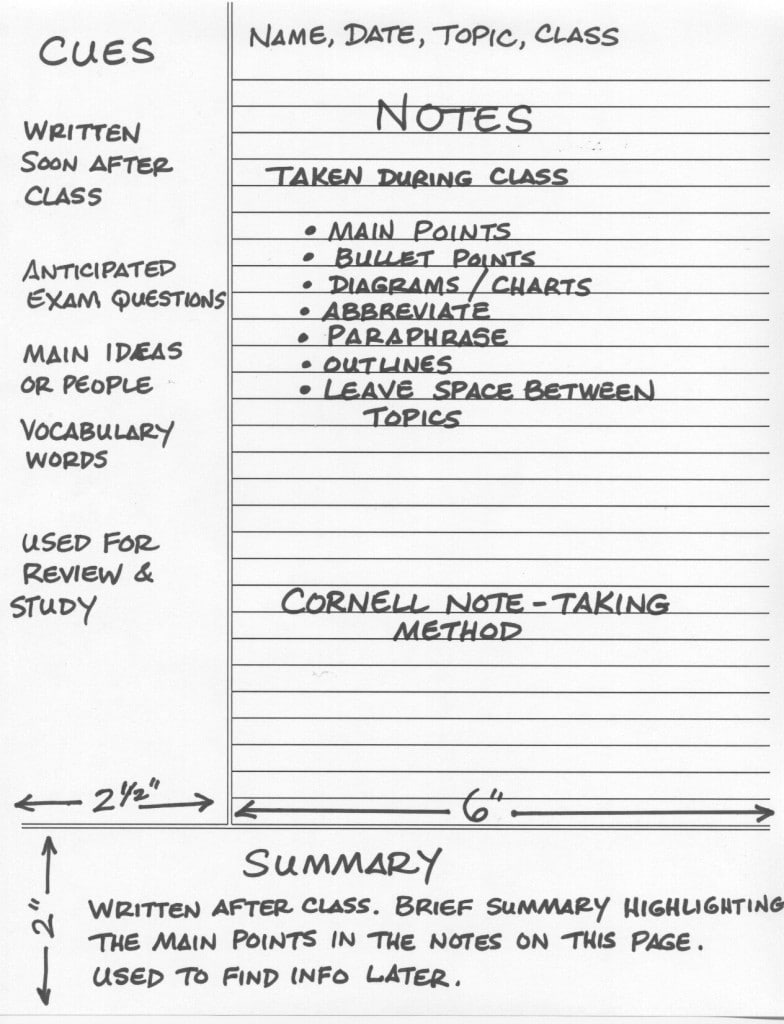
The Cornell approach summarises lecture notes. A summary of the major ideas, specifics, study cues, and conclusion
The Cornell technique is suggested for exam prep. Unlike the Outline Method, the Cornell Method forces pupils to think before writing. Each part has two columns (30% left column, 70% right column) and a summary at the bottom.
The right column is for notes, with significant points and formulas bulleted (similarly like the Outline Method). To analyse their notes, students must fill in the cues column on the left with keywords, questions and remarks. Finally, students must sum up the topic or chapter.
It takes longer, but students recall and assimilate information better, leading to better exam grades.

3)BOXING
The Boxing Method is gaining popularity. This time management method was based on the commonly utilised “time box theory” when planners and diaries were still widely used (before smartphones were invented). People used it to take notes by boxing comparable points. You can create an infinite number of specialised boxes for each topic on a page. Notes can be reorganised and redistributed using the Boxing approach.
4) MAPPER METHOD
Maps are the most prevalent teaching method in schools. This strategy is unique, effective, and straightforward. This approach organises notes into branches and topics. In most cases, the major issue is at the map’s top or centre. Make your map more fascinating with highlighters, coloured pens, or even sketches. This graphically beautiful note-taking method encourages creativity.

5) Illustrations
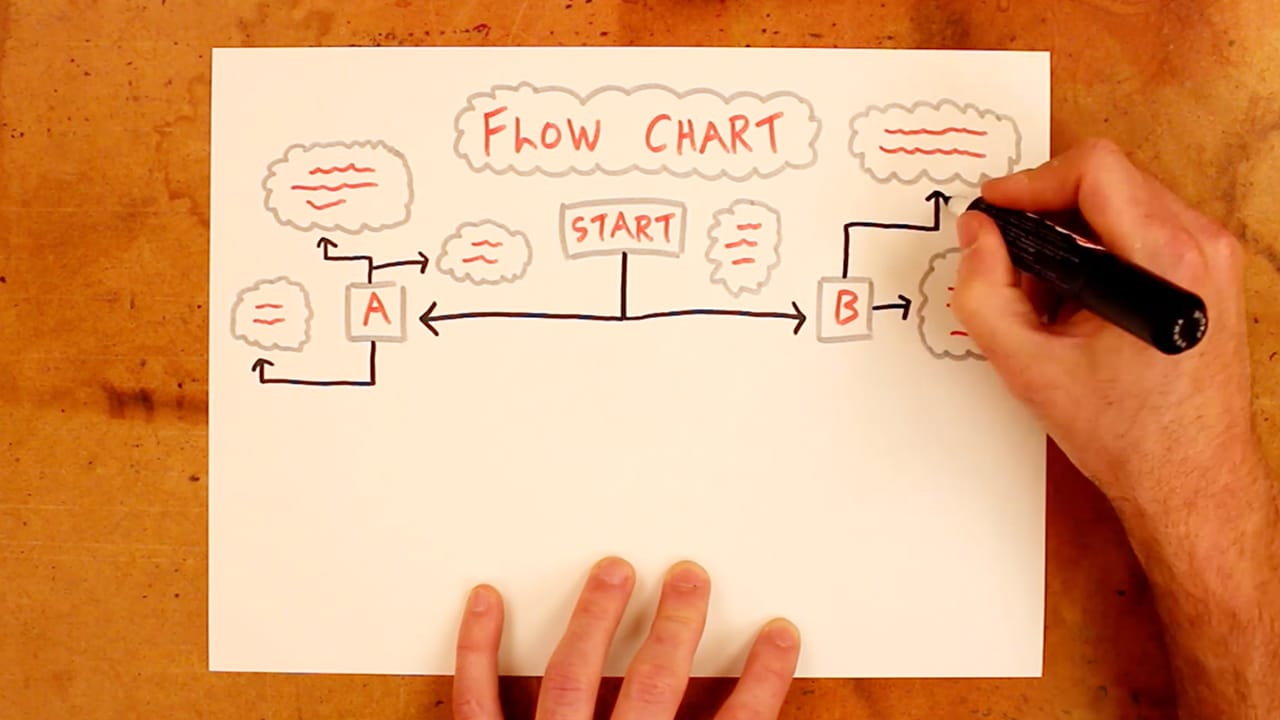
Charting is the recommended strategy for dealing with huge amounts of statistical data. This method uses columns and rows like a spreadsheet or table. Easily compared rows because each column represents a different category. You’ll notice that our editors commonly use charts to summarise topics for your convenience. In this situation, it perfectly sums up our article.


